Scripting analyses
http://www.riffomonas.org/reproducible_research/scripting_analyses/ Press 'h' to open the help menu for interacting with the slides
Welcome back to the Riffomonas Reproducible Research Tutorial Series. I hope you're able to make it through the last tutorial in which we discussed how to use a single Bash script to automate our analysis. It took a little effort but it's great to see how we could accidentally burn our project to the ground and with the help of Git and Bash, we're able to rebuild it with minimal further input from us.
In that tutorial, we used Mothur to process the raw sequence data to generate files that we'll be using in this and future lessons. If you'd never use Mothur before, you should definitely check it out. Other tools for analyzing 16S rRNA gene sequence data are out there but they tend to require a lot of other dependencies. These dependencies can be really difficult to track down, this is frequently called dependency hell for those trying to reproduce someone else's analysis.
If you go to the Mothur GitHub repository, you can get any version of Mothur you want and it's a self-contained executable. Similarly, our wiki has all past versions of the SILVA, RDP, and Greengenes databases that will work well with Mothur. We've really gone out of our way to make Mothur a great tool for encouraging reproducible analyses. In addition, in Mothur we have a command called make.sra which has been a game changer in terms of helping people to post their sequence data to NCBI's Sequence Read Archive, also called the SRA. This is the place your sequence data should be deposited before you submit your manuscript.
In today's tutorial, we'll be discussing some of the best practices for analyzing your process data using a scripting language. Here you have various options for tools that you can use, many people will use R or Python. I'll be discussing R although again I don't expect you to know much about R for this tutorial.
Now join me in opening the slides for today's tutorial which you can find within the Reproducible Research Tutorial Series at the riffomonas.org website.
Exercise
Name some limitations of using tools with graphical user interfaces (GUIs) for doing reproducible data analysis?
Name some limitations of using bash scripts for doing reproducible data analysis?
So before we get going and talking about scripting our analysis, let's remember what we talked about in the previous tutorial. So, take a couple of moments and think to yourself, maybe jot down in a piece of paper or write into a Word document.
What are some of the limitations of using tools with a graphical user interface, or GUI as they are called, for doing reproducible analysis? On the other hand, can you also think of some limitations of using bash scripts for doing reproducible data analysis? So a couple of thoughts come to mind when thinking about the limitations of both GUIs as well as using bash scripts.
So for GUIs, it can be frequent...it can be often difficult to document all the mouse movements and toggles that need to be checked as well as, you know, what you're entering into the formula bar, things like that. It's also difficult to maintain under version control. And so if you wanted to see where a bug was introduced, that's going to be really difficult.
And as we talked about in the previous tutorial, Git doesn't work very well with file formats like xlsx or docx files, that it really excels in working with text files. What are some of the limitations of using bash scripts? So although I think bash scripts are the way to go, I'm willing to admit that there are certainly limitations to using bash scripts.
So first of all, there's a learning curve. You have to know bash, you have to know your way around the command line. In addition, the code can also be pretty cryptic. Most people know how to use Excel, it's one of the beauties of Excel and why it's so popular is that it's so easy to use that one of my kids could pick it up who'd never seen a spreadsheet before and figure out how it works.
If I gave them bash code to read, it might be harder for them to read and harder for them to figure out what's going on and I think the same is true for anybody that's coming to replicate our analysis. And so, again, while the analysis might be reproducible because we can, you know, run bash and also striver.bash and recreate our project like we did at the end of the last tutorial, if somebody dug down and looked inside that file, they might be hard-pressed to tell you what exactly is going on with every line.
And so, again, there's ways around that. We can think about how we comment our code, we can educate people better, things like that to improve the transparency of what's going on in those bash scripts. So, although there's strengths and weaknesses of both approaches, I'm going to tell you that the best for reproducibility is using a bash script, although hopefully, you appreciate it also that one of the limitations of using a bash script for driving our analysis is that it's kind of a...it's kind of dumb, right?
There's no intelligence baked into it to tell the computer, to tell Linux where you're at in the work flow. And so, you know, when we reran the bash script, it started from the very beginning again although some of those reference files had already been downloaded.
And so what we'll talk about in a couple of tutorials is a tool called Make which is similar in idea to our bash script but has built-in intelligence to figure out where we're at in our dependency tree, what things have already been downloaded, what things have already been processed, and so where we're ready to pick up in the analysis.
Learning goals
- Articulate the strengths and weaknesses of point-and-click vs. command line tools
- Develop a set of best practices for scripting the analysis of data in a programmatic manner
- Define and identify violations of the DRY principle
- Apply tools that will make analyses reproducible when using random data
- Use tools to protect yourself and others from weird data
In today's tutorial, we're going to talk more about scripting our analyses. And so whereas before we used bash to script, kind of pulling together elements from different software, different tools, in this tutorial we're going to look at a scripting language such as R or Python. We're going to develop a set of best practices that you can use for scripting the analysis of your data analysis, we're going to define and identify one of those called the DRY principle which is short for "Don't Repeat Yourself," we'll apply tools that will make our analyses more reproducible when using random data.
We've already seen this a bit with using Mothur but I didn't tell you about it. And also, you will use some tools to protect ourselves and others from possibly encountering weird data, the idea of defensive programming. So to get you thinking about where we're going here, I want you to think about this case study where you've perhaps generated the visualization of an ordination diagram for your latest microbiome analysis and you've done it using point-and-click package like Microsoft Excel or Prism.
Case study
- You generate a visualization of the NMDS ordination data we generated in the last tutorial using a point-and-click package (e.g. Excel, Prism). You mimic the boring shape and coloring scheme that was in the original Kozich et al. paper. You show your PI, which gets them excited
Case study
- You generate a visualization of the NMDS ordination data we generated in the last tutorial using a point-and-click package (e.g. Excel, Prism). You mimic the boring shape and coloring scheme that was in the original Kozich et al. paper. You show your PI, which gets them excited
- Your PI starts asking questions...
- Can you change the color and shape of the plotting symbols?
- Is there a way to plot this in 3D with 3 NMDS axes?
- Is there a way to plot this in 3D with 2 NMDS axes and time?
- Could you create an animation over time?
What do you thinkSo you've mimicked the boring shape and coloring scheme that was in the original Kozich paper, I think it was like black and white circles, pretty nondescript. You show it to your PI which gets them really excited, okay? So PIs tend to do this, I know I do. And so the PI starts asking you questions: can you change the color and the shape of the plotting symbols?
Is there a way to plot this in 3D using three axes rather than in 2D with two axes? Can you plot...this is temporal data, so can we plot it in 3D where one of the dimensions is time? Could we perhaps think about how we could animate this over time? And so make a movie of how the murine microbiota was changing over time, okay?
Point-and-click has significant drawbacks
- Expense
- Centralized development
- Cannot be automated
- Not flexible
So these are just a handful of questions that somebody might come up with. And pretty quickly, you might think, "Well, yeah, those would be awesome but I wouldn't know where to begin," and part of that is because tools like Excel or Prism lock you into how you're doing your analysis their way.
Some of the other drawbacks of point-and-click methods like Excel or Prism is that they tend to be expensive. As a trainee, you might not realize this because someone else is paying for it for you but these tools are really expensive. Now, there's centralized development, there is a Excel way to make a plot, there is a Prism way to make a plot, and if somebody comes along with a new way to visualize data or something that you see that you want to incorporate into your analysis, well, if the folks at Microsoft don't incorporate that into Excel, you're kind of out of luck.
It also can't be automated, so how difficult would it be to change the plotting symbols of your figure? In Excel, you're going to have to go back into Excel, you're going to have to, you know, I think click on the thing...click on the points and then go somewhere to change the settings. It's not super easy and then you're going to have to export that into a new document and perhaps you then, you know, do some type of staging using Illustrator which is another really expensive tool and all that, because it's not automated, lowers the likelihood that you could reproduce it. It's also not flexible, you know, everything is kind of in their format, their way of doing things.
Open Source: Programmatic Analyses
- Tend to be "open source"
- Free, decentralized, automatable, (overly) flexible
- Extendible
So in contrast, if you were to use an open source tool like R or, say, Python, these all tend to be open source which means that they're free, they're decentralized which means that anybody can contribute code to it. You can open up...you can look under the hood and see how it makes a plot, you can modify that code, you can add code to change how plotting is done. These are things that are not possible with, say, something like Excel or Prism. They're also automatable, right? We can run R or Python from the command line and so I could change a line of my code and, voila, that will change the plot without me having to really muck around too much with formatting or things like that.
It's also very flexible and you might get frustrated because it's perhaps overly flexible, that there might be hundreds of parameters settings...maybe not hundreds, but a dozen parameter settings for things that you can change to alter the way that your plot looks. It's also extendable that you could take a simple plot in R and you could turn it into a gif to add animation or you could make a mp4 video of a plot, you could incorporate HTML into it so that it could become interactive.
These are all the beauties of open-source tools is that there's large numbers of data scientists out there and people like you and people like me who are contributing code, making packages to make the language better and customizable to our needs.
Changing aesthetics
- Change an option value, rerun the script
- Entire hexidecimal color pallete
So again, if we wanted to change an aesthetic like the plotting symbol, the plotting color, we can change the option value and rerun the script. We could incorporate this into our analysis driver bash file. It's pretty straightforward. We also have access to the entire color palette, so I don't know about you but when I go into Excel or any of the Microsoft software and I'm trying to pick a color, sometimes I can't remember what exact shade of blue I used because I'm trying to pick out of their kind of very categorical color palette.
Well, if I can give it a specific code for a specific color I want, then that's what I get and that's possible with a scripting tool like R or Python. But people have, again, taken that simple hexadecimal color palette and they've ripped off it, they've done really awesome, fun things.
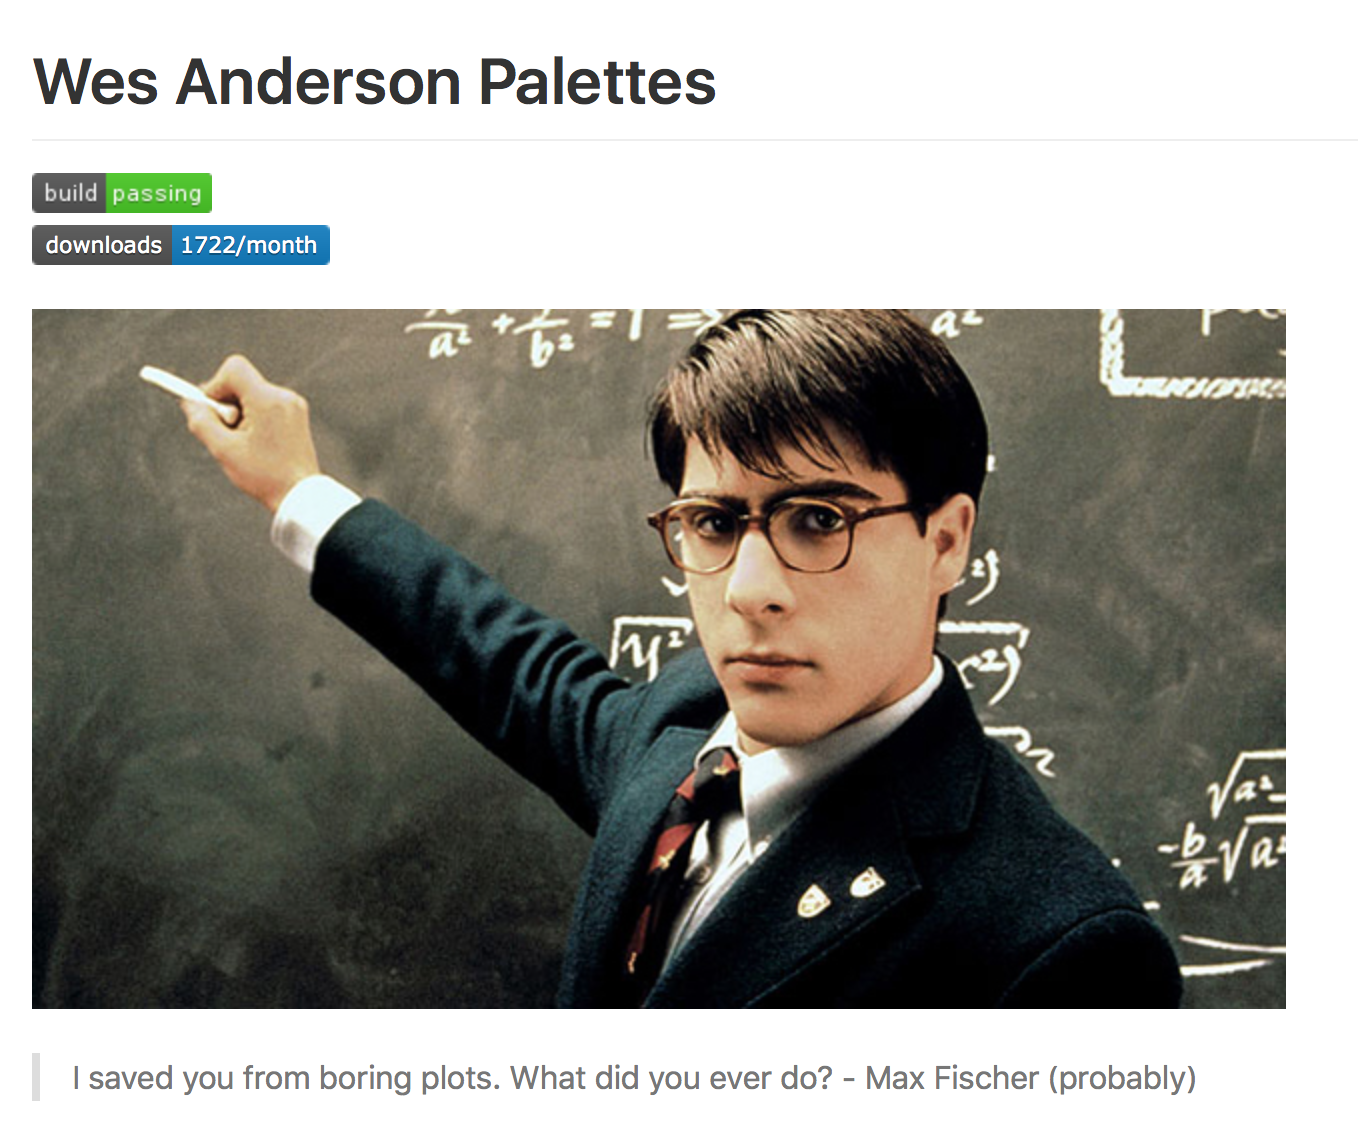
And so one of those is here, the Wes Anderson palettes that are inspired by the movie The RoyalTenenbaums or Darjeeling Limited or any of the Wes Anderson movies. My lab has also made one that corresponds to sports teams, so if I make a plot with blue and red, I can use the Chicago Cubs version of blue and red or University of Michigan's maize and blue, it's really adaptable.
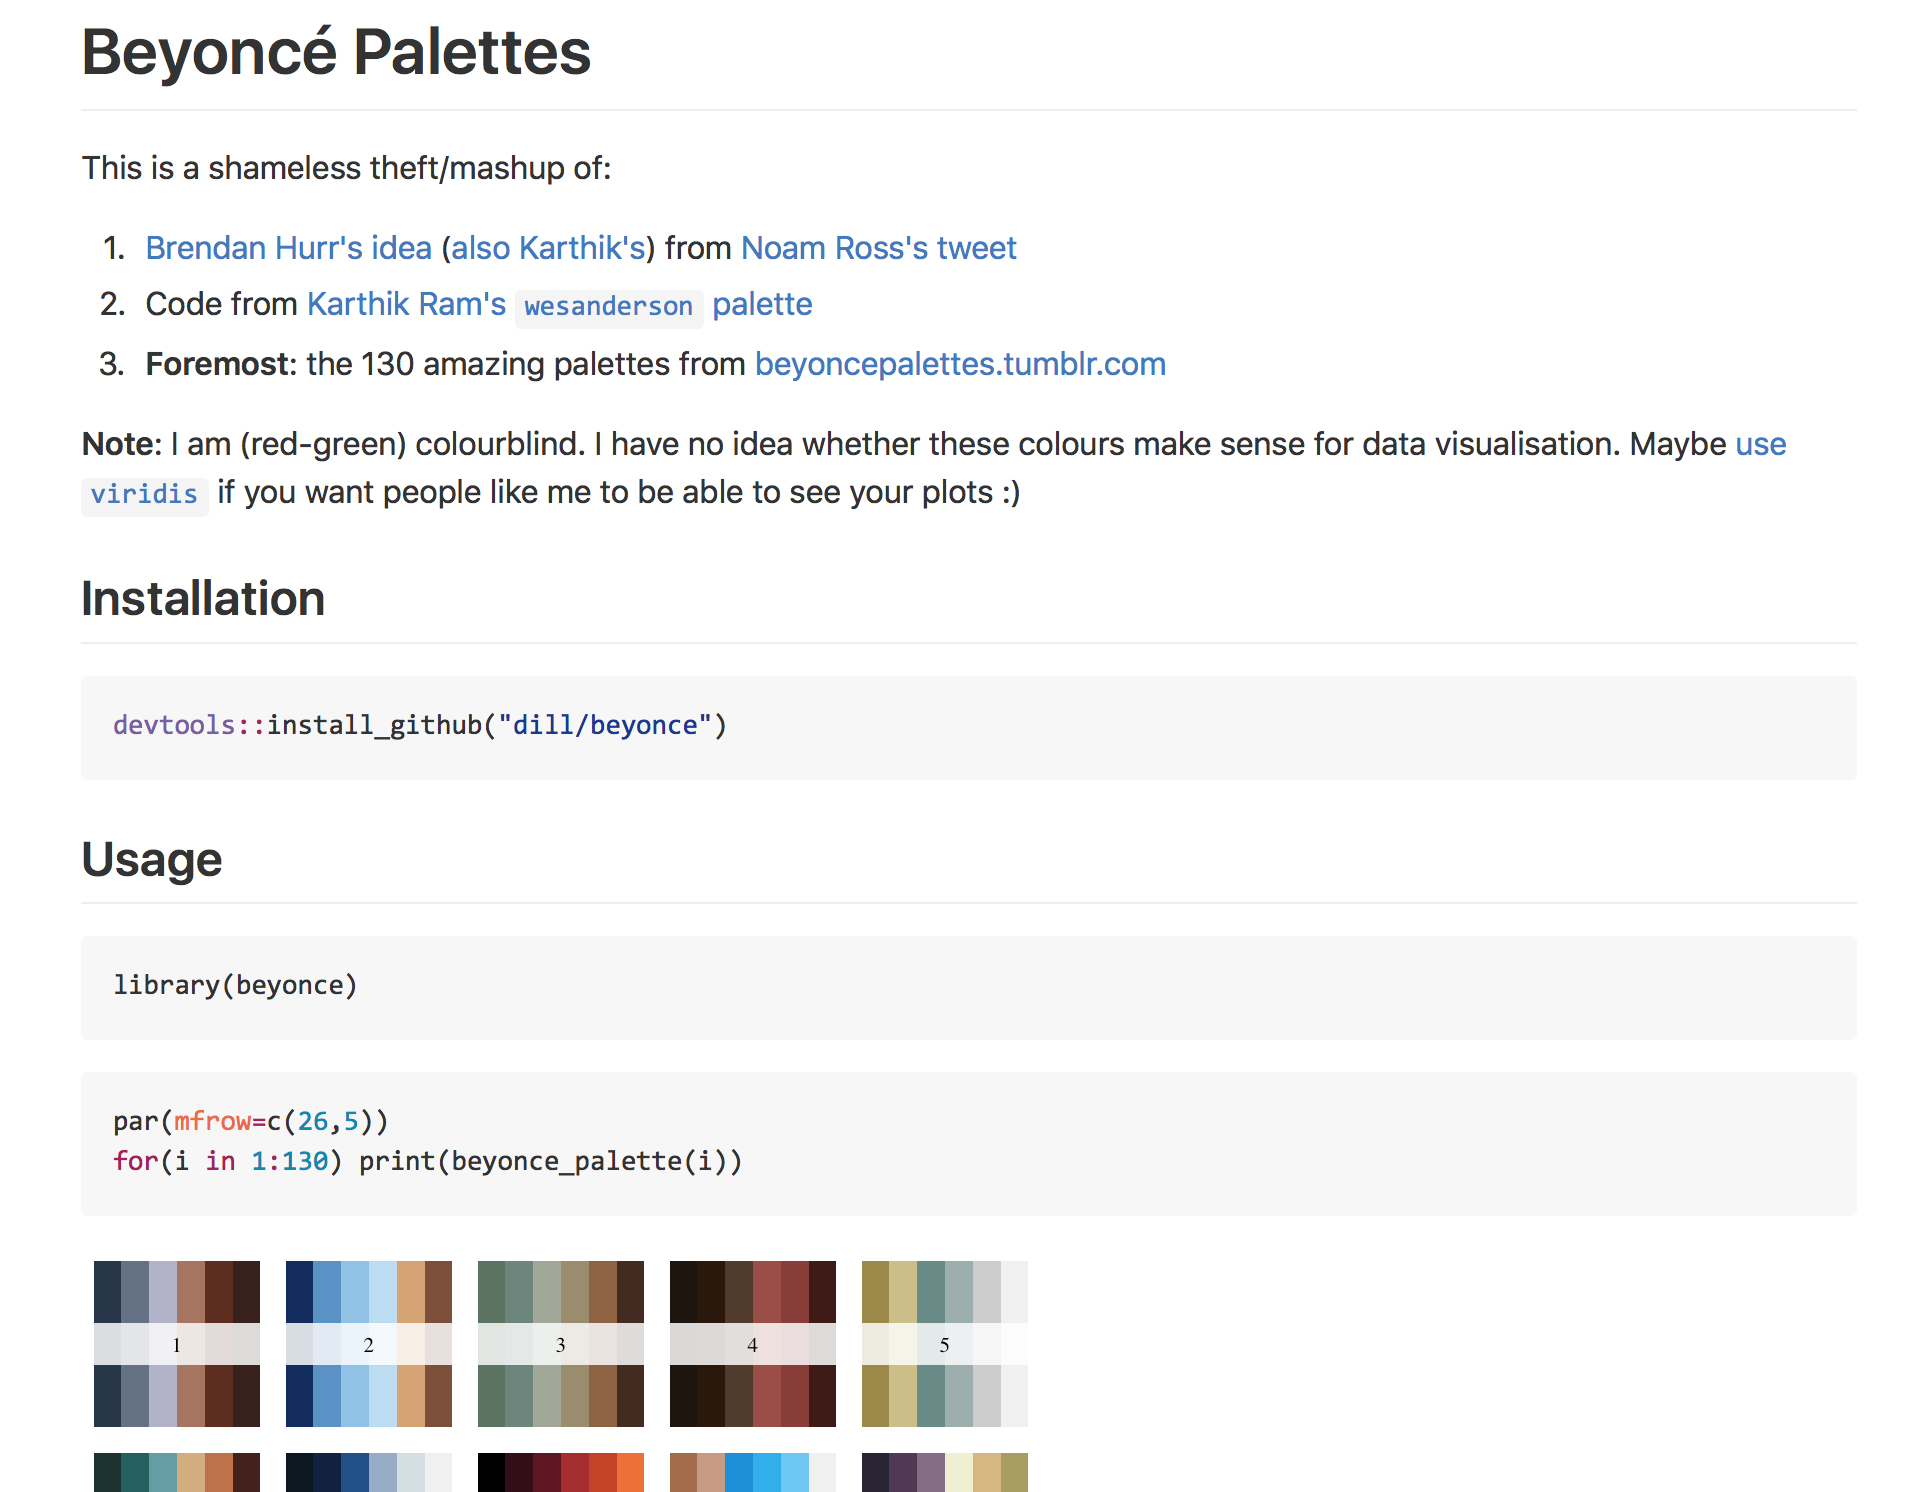
If you're a Beyonce fan, there are color palettes inspired by various pictures of Beyonce and the clothes that she's wearing, and so this is, again, seems a bit silly but it's fun, it shows you good colors that work well together, and helps to make our plots look a little bit more attractive than basic red, green, blue, black color schemes.
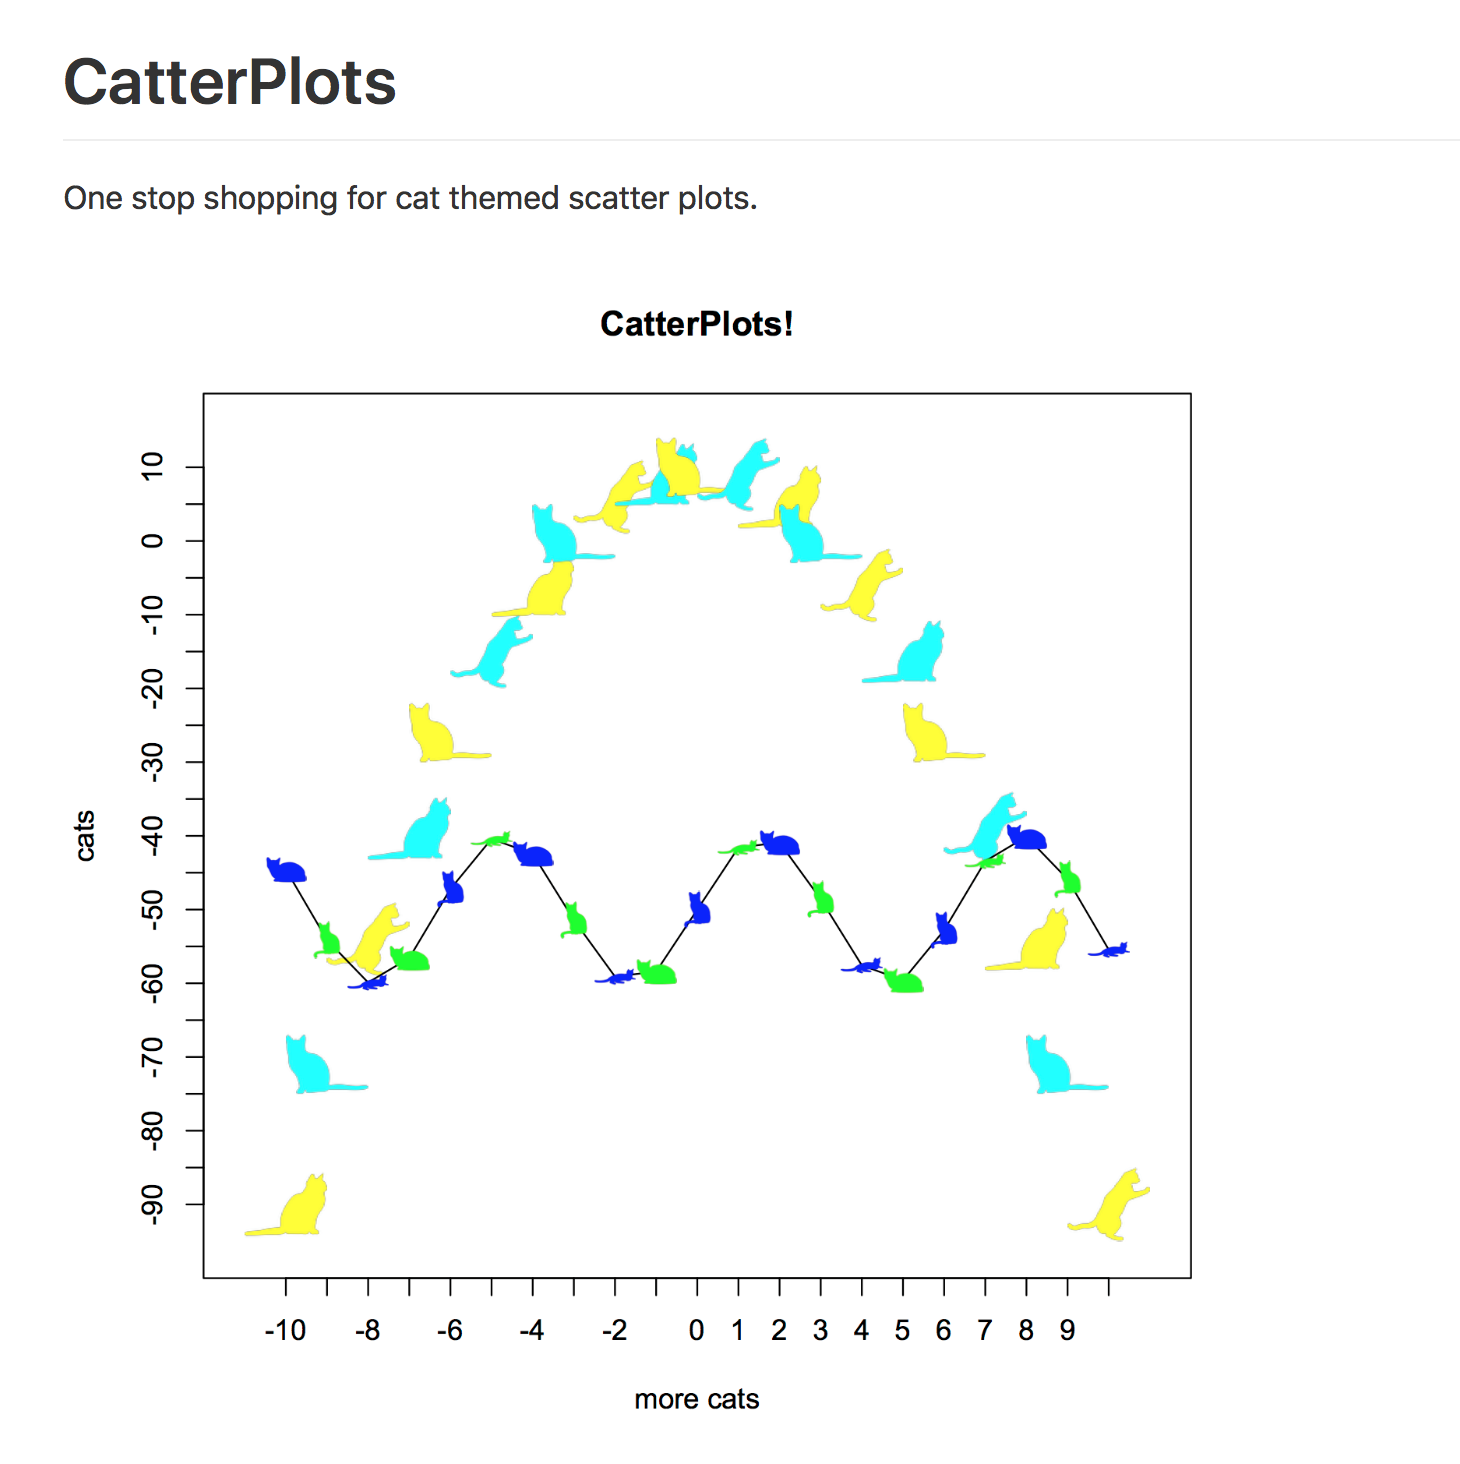
People have also in R made packages to change plotting symbols, and so you can make a Catterplot where instead of using circles or squares or diamonds or what-have-you, you can put cats in different poses into your plots and people are doing this, again, with other types of symbols.
And, again, this is silly, I don't know that you would make a Catterplot for your next manuscript, but it shows you the flexibility that you can customize the plotting symbols, you can customize the colors to do anything you want. Go try to make a Catterplot in Excel, good luck. It also allows you to think differently. There are numerous packages in R, Python, and other languages for data visualization to do things like interactive plots and analysis, again, incorporating HTML and JavaScript to make your plots interactive.
Think different
- Numerous packages in R, Python, etc for data visualization
- Interactive plots and analysis
- All generated by distributed groups of people that had a need, solved the problem, and made is available to others to use or improve upon
And again, these are all generated by developers around the world in myriad of fields from, say, economics to microbiology that have a need, they solve the problem, and then they made it available for others to use or improve upon. Again, this is the beauty of reproducible research, they made their methods available for others to then refer upon.
One of the packages I like is called RGL which is a...I don't know what RGL stands for actually but it allows you to generate 3D visualizations and if you were to open this in R, you could put your mouse on the image and you could then spin the image around any way you want.
So some people get excited about making 3D plots in a 2D medium which I think is totally worthless, but here what I have is a gif of the visualization from the Kozich data analysis where I've got the red and blue balls and I have it animated to spin the ordination around and so through this gif, you now see it in three dimensions which is pretty cool.
We're not to the point where we're ready to submit this type of figure for a manuscript because most of our manuscripts are too tied to a PDF type format but, again, for a presentation, this type of gif and this type of visualization could be very attractive and allow people to see things in three dimensions.
Another example is the gganimate package that builds upon a series of plotting tools called ggplot and here is data from the famous Gapminder dataset looking at the life expectancy of different countries by their GDP per capita.
Each dot represents a different country, the color is according to the continent they're on, and the size of the point indicates the population and it's animating over five-year increments. So again, this is a really cool way...perhaps not perfect for every type of analysis but it's a really cool way to represent data and instead of seeing images as being static like they are, say, in Excel, we can now animate these images to get a better representation of, say, temporal patterns. So this plot got one, two, three, four, five different variables going on in a fairly simple and attractive way.
That's fancy and all...
... but it's eye candy. Don't lose track of the ablity to make analyses more reproducibe because we can programmatically generate these plots
So again, that's fancy and all but it's eye candy, that's like an advantage of R or Python. It's eye candy, so don't lose track that the ability to make an analysis more reproducible is because we can programmatically generate these plots.
Interactive vs. programmatic analyses
- You can run R and other scripting languages in an interactive mode
- This has many of the same limitations of point-and-click tools
- The difference between an interactive and programmatic analysis is that the programmatic analysis utilizes a script to store the commands for repeated and automated use
With several lines of code, we're able to generate those very complicated plots and if we wanted to change something, we could alter the line of code, rerun the code, and get a new version of the plot. That's the advantage of the scripting languages, the eye candy is an extra benefit. So there's a difference between what I will call interactive versus programmatic analyses.
You can run R and other scripting languages in an interactive mode where you go into R and you can write commands at the console and this is similar to, perhaps, Excel, where you go into Excel and you start manipulating things and you generate a plot. So this has many of the same limitations between going in interactively and using R and using Excel because you're getting into...unless you have a way to document the code you're entering at that command prompt within R, then it's really no better or different than using Excel.
The difference between an interactive programmatic analysis and a programmatic one is that a programmatic one will use a script to store the commands for repeated and automated use. So the big difference I want to drive home to you is that if you're using R or Python to make plots, it's critical that you're recording those commands in some type of script file that we'll then be able to use as part of our analysis driver file.
Programming
- We've already made a couple of scripts in
bashandmothur - Scripts are text-based files for automating analyses
- These are the way we tell the computer how to make a paper airplane (or something more useful)
- There are many formal languages: (bash), R, Python, Perl, Julia, Go, Java, C/C++, Fortran, Pascal, etc
So we've already made a couple of scripts using bash and Mothur's syntax, scripts are text-based files for automating analyses, they're a way to tell the computer, so to speak, how to make a paper airplane or something more useful. There are many formal languages out there for programming.
So we've already used bash, that's a type of language. I've mentioned R, Python. There's others like Perl, Julia, Go, Java, C/C++, Fortran, Pascal, these all have varying usages and varying popularities across the field, I don't know all of these.
Which language should you chose?
- Dunno. It depends.
So which language should you choose? I don't know.
Which language should you chose?
Dunno. It depends.
Narrow the list
- R
- Python
- The others are either significantly harder to use, aren't widely used, or aren't fully developed yet
So which language should you choose? I don't know.
So I'll help you to narrow the list. I would tell you to choose between R or Python, okay? I know R pretty well, I can read Python, I can't code in Python. I know, maybe that's a disappointment to you. I really like R and I find it does everything I want.
The others are significantly harder to use, they're either...or they're not widely used or aren't fully developed yet. If you go into the social media, you'll see people getting excited about the latest greatest programming language and resist the temptation to go run and play with that. I think it's best to pick one language to learn really well and get the most out of that you can and once you know that language pretty well, well, then go pick up a different language.
Which language should you chose?
Dunno. It depends.
Narrow the list
- R
- Python
- The others are either significantly harder to use, aren't widely used, or aren't fully developed yet
Start asking questions
- What do your labmates use?
- What do others on campus use?
- If you needed to solve a problem or have someone check your code, who would you ask? What do they use?
So which language should you choose? I don't know.
So I'll help you to narrow the list. I would tell you to choose between R or Python, okay? I know R pretty well, I can read Python, I can't code in Python. I know, maybe that's a disappointment to you. I really like R and I find it does everything I want.
The others are significantly harder to use, they're either...or they're not widely used or aren't fully developed yet. If you go into the social media, you'll see people getting excited about the latest greatest programming language and resist the temptation to go run and play with that. I think it's best to pick one language to learn really well and get the most out of that you can and once you know that language pretty well, well, then go pick up a different language.
I would encourage you to also start asking questions as you're picking a language to use. What do your lab mates use? The people around you, your community, those other people on campus around you, what do they use? As someone that's a PI and has various people in the lab with different skill sets, it's really important to me and valuable to me for everybody to know the same language, and so my language is an...oh, I'm sorry, my lab is an R lab and we have everybody in the lab that uses R.
And the advantage then is that if you need to solve a problem or you need someone to check your code, who would you ask? And so people in my lab if they run into a problem, they know I know R, they know their lab mates know R. So go to those people and you can then get help from them. So if you're the only person on your campus using this new programming language, well, where are you going to get help?
Who's going to check it out? Who's going to help you to grow as a programmer?
Find your community and nourish it
So I would encourage you to find your community and to nourish it, to find those around you that are doing similar types of analysis, figure out what they're doing, and go with that. That is really the number one critical factor in picking a programming language to use.
Beware brogrammers and language wars
The other thing I would tell you is to beware of brogrammers and so-called language wars. If you do a Google search for R versus Python say, you'll get numerous blog posts that are just flame wars about why one language is better than the other.
Those are horrible, I hate those blog posts because they're not productive and usually the points that they're differentiating between R and Python are so nuanced that a beginner isn't going to benefit from those. Yeah, I know there's problems with R but you know what? I know how to work around them and I can work around them a lot easier than, say, learning Python or learning a different language.
So pick a language where you've got a great community around you and go with that. The other thing about brogrammers is that these are bros, these are guys typically who are online and they're very happy to tell you how smart they are and to tell you why you're doing it wrong. And be aware of that but also be aware that that's not everybody in the community and there are brogrammers in the R community, there are programmers in the Python community, but that's really not the community. And so from me, I'm sorry if you run into those people but no, that's not the most of us who are using R or Python.
R
- My lab, many people at my institution, and I use R
- I really like the broader R community
- Won't try to teach you R here, there are numerous other resources for that (see my minimalR tutorial)
- Pretty much everything I say about R is true for Python
- The goal is to demonstrate how to programmatically analyze data - the tooling doesn't matter
So like I said, my lab, my institution, most of us are using R, there are people here using Python, that's great, we learn a lot from them but my lingua franca in the lab, we use R. I really like the broader R community, a lot of great people, people that have helped me out as I've grown as a data analyst. I'm not going to try to teach you R here, there's other resources available for doing that. One I would point you to is my minimalR tutorial that's also at the riffomonas.org website.
Pretty much anything I'll say for R is also true for Python, okay? Again, there are nooks and crannies where there's differences but those frequently aren't super relevant for people getting going in programming. My goal here today in this tutorial is to demonstrate how we can programmatically analyze data, the tooling that we use to do that isn't super important.
General principles
- Worry about the outcome, not the path
- Don't Repeat Yourself (DRY)
- Defensive programming and testing
- Setting random number generator seed
- Package versions
- R quirks to avoid
So there's some general principles that I want to go over with you in this tutorial, some of these are specific to R but most of them, like I said, are pretty general. And so we're going to talk about worrying about the outcome, not the path, don't repeat yourself, defensive programming and testing, setting the random number generator seed, package versions, and then some R quirks to avoid.
Worry about the outcome, not the path
- The most important thing is to get the correct answer
- Don't worry so much about whether you wrote the most efficient program
- If your analysis is taking a long time to run, then worry about your efficiency
- There are many tricks and tools for speeding up R (again, beware language wars)
So the number one thing that I tell people is that the beauty of a language like R is that there are many ways to achieve the same goal. That's also perhaps the biggest problem for many people is that there is no one way to do something. And so I would tell you don't worry so much about whether you wrote the most efficient program, you might write an analysis that takes a hundred lines and I might write it in one but if we get the same answer in the end, that's a bonus, that's what we're after.
You can go back later and improve and tighten up the code. Your code that might be a hundred lines might be a lot better documented, mine might not be so well documented, it might be too clever by half. At the same time, your hundred lines of code is going to be a lot more difficult to maintain than, say, my one line of code. If your analysis is taking a long time to run, then worry about your efficiency.
There's a lot of tools out there and tricks for speeding up your R code and, again, beware of the language wars where people get off on telling you how much faster their language is than another language. What I find is a lot of those language war fights over speed, they're typically cooking the analysis to make their language look a lot better than another language, so beware.
Don't Repeat Yourself (DRY)
- If you have a line(s) of code that you use multiple times within a script or across scripts, put that into a function or define a variable
- You can replace those lines where there was repitition with a call to the function or variable
- Go from maintaining 5 copies of code to 1
- Significantly limits headaches
So the next principle is don't repeat yourself, we call this the DRY principle. So you might have lines of code that you use multiple times in a script or across scripts, so the DRY principle is that you take those lines that you're repeating and you put them together in a function or use them to define a variable and then whenever that code is present in your code, you'll replace that with a call to the function or a call to the variable.
And so that way then, instead of maintaining, say, five copies of a code, you now only need to maintain one and this significantly limits the headaches and difficulty in maintaining your code. So some examples of where I see this come up frequently is in terms of defining your color and symbol schemes and plots that I might like to have simple variables to define my colors or my plotting symbols.
Examples...
- Define color and symbol scheme
figure_colors <- c(early="red", late="blue")figure_pchs <- c(early=19, late=19)- Utility functions
calc_shannon <- function(otu_count_vector){ relative_abundance <- otu_count_vector / sum(otu_count_vector) shannon <- -1 * relative_abundance * sum(log(relative_abundance)) return(shannon)}Also having utility functions like this one here for calculating the Shannon index, these lines of code...you know, it's a pretty simple function I'll admit, but if I had to calculate the Shannon index three or four times across the data analysis, it sure would be nice to only have to worry about one version of that in case bugs crop into my code.
Doh.
calc_shannon <- function(otu_count_vector){ relative_abundance <- otu_count_vector / sum(otu_count_vector) shannon <- -1 * relative_abundance * sum(log(relative_abundance)) return(shannon)}otus <- c(50, 40, 30, 20, 10, 5, 2, 1, 1, 1, 1, 1)calc_shannon(otus) [1] 13.1012820 10.4810256 7.8607692 5.2405128 2.6202564 1.3101282 [7] 0.5240513 0.2620256 0.2620256 0.2620256 0.2620256 0.2620256And sure enough, when I use this function, I find an error. So here's my function, calc_shannon. I've defined some otus accounts, I then plug this into calc_shannon and I get a vector of numbers out when the Shannon should only give me one number, it should give me the diversity. And so if I look at my code, can you see where there's a bug? I see it here. I have -1 times relative abundance times the sum of the log relative abundance.
Let's try that again...
calc_shannon <- function(otu_count_vector){ relative_abundance <- otu_count_vector / sum(otu_count_vector) shannon <- -1 * sum(relative_abundance * log(relative_abundance)) return(shannon)}calc_shannon(otus)[1] 1.769286This relative abundance term is supposed to be inside the summation, it's supposed to be -1 times the sum of the relative abundance times the log of the relative abundance, okay?
Let's try that again...
calc_shannon <- function(otu_count_vector){ relative_abundance <- otu_count_vector / sum(otu_count_vector) shannon <- -1 * sum(relative_abundance * log(relative_abundance)) return(shannon)}calc_shannon(otus)[1] 1.769286
To correct a bug in the calculation of the Shannon index or make it more efficient, I only need to change these lines of code - not where they're repeated
This relative abundance term is supposed to be inside the summation, it's supposed to be -1 times the sum of the relative abundance times the log of the relative abundance, okay?
So, again, if I had this repeated five times across my code for my analysis, I'd have to be sure I updated it in every place. Instead, if I have calc_shannon, I only need to change it in one place and that's what I've done here and now I have the correct value coming out of calc_shannon. So, again, to correct the bug in the calculation of this index or to make it more efficient say, I only need to change these lines of code, not everywhere that it's repeated and I have fallen in the trap of repeating my code and finding that when I go back and fix a bug that I don't always replace every instance of that bug.
As your analysis grows...
- As an example, assume that you have three figures and you want to use the same coloring and symbol scheme for each. To make things compartamentalized, you put the code for each figure in a separate R script.
And so, really, having this principle in mind, the DRY principle, don't repeat yourself, really will make your life so much easier. So as your analysis grows, assume that you've got three figures from this murine microbiome study and you want to use the same coloring and simple scheme for each figure.
So to make things compartmentalized, you put the code for each figure in a different file and I've already shown that where when we looked at my GitHub repository, I had in my code directory a file called Generate Figure 1, Generate Figure 2, Generate Figure 3, 4, or 5, right? And so I might have five figures for generating figures and three or four of those figures might use the same coloring scheme because I'm looking at, say, early and late time points in different ways but I'd like to use the same coloring scheme across all my plots so that when a reader looks at them, they quickly know what's an early and what's a late time point.
As your analysis grows...
As an example, assume that you have three figures and you want to use the same coloring and symbol scheme for each. To make things compartamentalized, you put the code for each figure in a separate R script.
You'd have to define
figure_colorsandfigure_pchsin each R script.
And so, really, having this principle in mind, the DRY principle, don't repeat yourself, really will make your life so much easier. So as your analysis grows, assume that you've got three figures from this murine microbiome study and you want to use the same coloring and simple scheme for each figure.
So to make things compartmentalized, you put the code for each figure in a different file and I've already shown that where when we looked at my GitHub repository, I had in my code directory a file called Generate Figure 1, Generate Figure 2, Generate Figure 3, 4, or 5, right? And so I might have five figures for generating figures and three or four of those figures might use the same coloring scheme because I'm looking at, say, early and late time points in different ways but I'd like to use the same coloring scheme across all my plots so that when a reader looks at them, they quickly know what's an early and what's a late time point.
So I would have to define figure_colors and figure_pch in each R script, that is not DRY. So alternatively, I could create a file in my code directory called utilities.R. This utilities file then would contain things that I'm going to use across multiple scripts, things like figure_colors or figure_pch's.
As your analysis grows...
As an example, assume that you have three figures and you want to use the same coloring and symbol scheme for each. To make things compartamentalized, you put the code for each figure in a separate R script.
You'd have to define
figure_colorsandfigure_pchsin each R script.
Not DRY.
And so, really, having this principle in mind, the DRY principle, don't repeat yourself, really will make your life so much easier. So as your analysis grows, assume that you've got three figures from this murine microbiome study and you want to use the same coloring and simple scheme for each figure.
So to make things compartmentalized, you put the code for each figure in a different file and I've already shown that where when we looked at my GitHub repository, I had in my code directory a file called Generate Figure 1, Generate Figure 2, Generate Figure 3, 4, or 5, right? And so I might have five figures for generating figures and three or four of those figures might use the same coloring scheme because I'm looking at, say, early and late time points in different ways but I'd like to use the same coloring scheme across all my plots so that when a reader looks at them, they quickly know what's an early and what's a late time point.
So I would have to define figure_colors and figure_pch in each R script, that is not DRY. So alternatively, I could create a file in my code directory called utilities.R. This utilities file then would contain things that I'm going to use across multiple scripts, things like figure_colors or figure_pch's.
That way then in each of my five generate_figure or whatever scripts, at the top of that, I could put the command source code/utilities.R, and that way then figure_colors, figure_pch's would be brought into that script and it would then have that color scheme.
Create a code/utilities.R file
#code/utilities.Rfigure_colors <- c(early="red", late="blue")figure_pchs <- c(early=19, late=19)Create a code/utilities.R file
#code/utilities.Rfigure_colors <- c(early="red", late="blue")figure_pchs <- c(early=19, late=19)
Then you can run this in each of your scripts:
source('code/utilities.R')Create a code/utilities.R file
#code/utilities.Rfigure_colors <- c(early="red", late="blue")figure_pchs <- c(early=19, late=19)
Then you can run this in each of your scripts:
source('code/utilities.R')
Good practice to put this source command and any library loads at the top of the script
It really is a useful practice I think to put these source commands and any library loads at the top of the script. Again, the advantage of this is that your PI might say, "Red and blue are a bit too bright, why don't we use red and Dodger blue?" And so instead of having to change blue to Dodger blue in each of your five R scripts, you change it here and then all the five R scripts that source this file will now be using Dodger blue instead of the brighter blue color.
"Wow, that's a useful set of functions!"
- Your labmates might really like some functions you've written
So as you do this and as you get good at using R to script your analyses, your lab mates might find that they really like some of the functions you've written, they really like how you've made some plots or various color schemes you've used and they want to use them.
"Wow, that's a useful set of functions!"
Your labmates might really like some functions you've written
Your collaborators might really like some functions you've written
So as you do this and as you get good at using R to script your analyses, your lab mates might find that they really like some of the functions you've written, they really like how you've made some plots or various color schemes you've used and they want to use them.
Collaborators on your papers might really like some of the functions you've written as well.
"Wow, that's a useful set of functions!"
Your labmates might really like some functions you've written
Your collaborators might really like some functions you've written
- Some unknown person on the otherside of the world might really like some functions you've written
So as you do this and as you get good at using R to script your analyses, your lab mates might find that they really like some of the functions you've written, they really like how you've made some plots or various color schemes you've used and they want to use them.
Collaborators on your papers might really like some of the functions you've written as well.
Some unknown person on the other side of the world might really like something you've done as well
"Wow, that's a useful set of functions!"
Your labmates might really like some functions you've written
Your collaborators might really like some functions you've written
- Some unknown person on the otherside of the world might really like some functions you've written
- Write a package - Some have suggested that one way to encapsulate a data analysis is to make a package out of it
So as you do this and as you get good at using R to script your analyses, your lab mates might find that they really like some of the functions you've written, they really like how you've made some plots or various color schemes you've used and they want to use them.
Collaborators on your papers might really like some of the functions you've written as well.
Some unknown person on the other side of the world might really like something you've done as well
Don't laugh, it happens. And so what do you do? Well, you can write a package. And so things like ggplot or RGL or gganimate or Wes Anderson or the Beyonce color palette, these are packages that other people have developed to share with others.
There's also been some grumblings within the R stats community that a package might be a useful tool for thinking about how to disseminate a reproducible data analysis. And so if you think about it, a package contains data and it contains functions for working with that data, and so the idea would then be that you could encapsulate all the data and code for a project into a package.
I tend to find that my projects are a bit bigger and more complicated than a typical package and so this really hasn't worked for me, but if you click on this link for making a package out of it, you might get some good ideas that really inspire your own reproducible research practices.
Defensive programming and testing
- You are your own worst enemy
- Users do weird things
- Try to anticipate weird things...
- Providing a function the wrong type of variable
- Dividing by zero
- Build in code to test for weird behavior and either fail nicely or give an error message

The next principle to think about is defensive programming and tests. So I am my own worst enemy, I do all sorts of dumb things that I'm telling you not to do here or I ignore things that I'm telling you to do here and I introduce all sorts of crazy things, and so it's best to be defensive, to anticipate craziness to come at you. In maintaining Mothur, Sara Westcott who works with me and I interact with a lot of users who just do weird things that we never anticipated.
And so we try to anticipate these weird things. So if someone gives you a function the wrong type of variable, so say we had that Shannon function and someone gives you a string of text, maybe it should complain. Another problem that we frequently run into is dividing by zero. So when we calculated the relative abundance in that calc_shannon function, well, what should that function do if when we calculate the relative abundance, the denominator is zero, right?
So these are weird things that you might not anticipate it's going to happen and it might not be super critical for your own personal use but as you share your code with others or others grab your code, having defensive programming built into your code really helps. You can also use a function...use a package from R called testthat, T-E-S-T-T-H-A-T, that does automated testing to make sure that as you change your code that your tests...the behavior of your functions continue to work.
Defensive programming and testing: Example
calc_shannon <- function(otu_count_vector){ relative_abundance <- otu_count_vector / sum(otu_count_vector) shannon <- -1 * sum(relative_abundance * log(relative_abundance)) return(shannon)}data <- c(-1,-2,-3,-4)calc_shannon(data)#[1] 1.279854Hmmm. That's not good.
So again, as an example, we have our calc_shannon function and if I, say, gave it an OTU vector of data that were all negative numbers, somehow calc_shannon still gives me a value back and that's probably because when I calculate the relative abundance, the negative on top cancels the negative on the bottom and everything becomes positive.
Defensive programming and testing: Example
calc_shannon <- function(otu_count_vector){ relative_abundance <- otu_count_vector / sum(otu_count_vector) shannon <- -1 * sum(relative_abundance * log(relative_abundance)) return(shannon)}data <- c(-1,-2,-3,-4)calc_shannon(data)#[1] 1.279854Hmmm. That's not good.
calc_shannon <- function(otu_count_vector){ if(all(otu_count_vector >= 0)){ relative_abundance <- otu_count_vector / sum(otu_count_vector) shannon <- -1 * sum(relative_abundance * log(relative_abundance)) } else { warning("One or more of the values were less than zero.") shannon <- NA } return(shannon)}data <- c(-1,-2,-3,-4)calc_shannon(data)#[1] NA#Warning message:#In calc_shannon(data) : One or more of the values were less than zero.Better.
So again, as an example, we have our calc_shannon function and if I, say, gave it an OTU vector of data that were all negative numbers, somehow calc_shannon still gives me a value back and that's probably because when I calculate the relative abundance, the negative on top cancels the negative on the bottom and everything becomes positive.
But perhaps calc_shannon should be smart enough to know that this is nonsense data, it should be smart enough to know that all of our counts should be positive. And so what we might do is to run a test to say that all of our otu_count_vector values greater than or equal to zero, okay? If it is, then we run those lines of code, otherwise, we send out a warning that says, "One or more of the values were less than zero," and it returns a Shannon value of N/A and so you see what the output here would look like.
Defensive programming and testing: Tools
if() ... else if() ... else- the finalelseis a catch all for situations you can't anticipatelengthandis.xxxxxfunctions (e.g.is.numeric,is.character,is.logical)allandanystopifnot- script stops if something is not true- Test code with known examples
testthatpackage for automating code tests
So again, these are defensive programming practices to test that you're getting the right input, that your code is doing the right thing. Some tools that we have that I showed in that example with the Shannon calculator are if functions, "if blocks so if," "else if," and "else," that final "else" is to catch any situations you can't anticipate.
Again, users do weird things and you are your weirdest user. Also find that the "length" function as well as the "is" functions, so things like is.numerical, is.character, is.logical, are useful functions for testing to make sure that your functions are getting the right data. Functions like "all" and "any" are great, there's a function called "stopifnot"which will stop your code if a certain condition is not met.
And as I mentioned, you can test your code with known examples but it's better to automate those code tests using the testthat package. So the next thing to think about is setting a random number generator seed. A lot of the analyses we do use nonparametric statistics where we're using a random number generator to test the significance of our observations.
Setting random number generator seed
- Some functions make use of random numbers to perform an analysis
- Making use of the ability to set the random number generator seed will insure that you get the same randomness each time
- Remember
get_shared_otus.batch?
set.dir(input=data/mothur, output=data/mothur, seed=19760620)- This set the mothur random number generator to
19760620(my birthday in ISO 8601 format)
And so you might remember from our get_shared_otus.batch file, that at the top line we had set.dir and there was a...there is an option of seed 19760620. Well, many of the functions in Mothur depend upon a random number generator, so when we do our clustering, there's randomness, when we do the NMDS, there's randomness, when we do rarefaction, there's randomness.
And so by setting a seed for the random number generator, we will still get pseudo-random numbers to come out of the random number generator but they will all be in the same order. And so if we run that analysis repeatedly with the same seed, we'll get the same results over and over again but if we don't set the seed, then we'll get variation.
And so I tell people to pick a consistent seed, I use my birthdate, so I was born in June 20th of 1976, you might pick one or you might pick some other number and don't try to hack your data to pick a random number generator that gives you the right result, that's bad. Pick a number, stick with it, use it across all your projects, and your results should really be insensitive to the seed that you pick.
Setting random number generator seed in R
> runif(5)[1] 0.8870255 0.8145864 0.7129467 0.6600283 0.1066385> runif(5)[1] 0.1168198 0.5150428 0.1028263 0.9711794 0.7676322> runif(5)[1] 0.05080043 0.51089731 0.99899027 0.84039403 0.08163530> set.seed(19760620)> runif(5)[1] 0.96847218 0.11941491 0.42317798 0.09717774 0.94767339> set.seed(19760620)> runif(5)[1] 0.96847218 0.11941491 0.42317798 0.09717774 0.94767339> set.seed(19760620)> runif(5)[1] 0.96847218 0.11941491 0.42317798 0.09717774 0.94767339- The general gist of your analysis should be insensitive to the random seed
- Pick a number (e.g. birthday, anniversary, 1) and stick to it across your analyses
And so again, here's an example in R that if you'll use the runif command which will generate five random...runif will generate a random number between 0 and 1 and if you give runif the number 5, it'll generate five numbers. So if we run runif three times, we'll get 15 different random numbers, but if I set a seed and then run runif, I get five random numbers and if I do it again, I get the same five random numbers, okay?
So this makes the analysis much more reproducible. So, again, pick a number, stick with it, it could be your birthday, your anniversary, one, and stick to it across your analyses.
Package versions
- Packages change either through incroporating or deprecating options or changing underlying algorithms
- Need to know version numbers of code being used so that others (you!) can replicate your work or understand why there are differences
Another area to think about in terms of programming your analyses is to keep track of the package versions that you use. So packages change either through incorporating or deprecating options or by changing the underlying algorithms. Again, Mothur is on Version 1.40 and things have changed from Version 1 to Version 40. We get emails from people saying, "You know, I can't run this certain function," and we say, "Well, what version are you using?" And they say, "Well, I'm using Version 10."
It's like, well, you know, that was from, like, six, seven years ago, a lot's changed. And so if somebody used Version 10 for their analysis then, yeah, you might want to go back and use Version 10 to use the same software they were using back then. And so the same happens with any type of code that you use, so we need to know the version numbers of the code being used so that you and others can replicate the code and perhaps understand why there are differences between the versions.
Tooling
The output from sessionInfo would ideally go into the general README file
> sessionInfo()R version 3.3.2 (2016-10-31)Platform: x86_64-apple-darwin13.4.0 (64-bit)Running under: OS X El Capitan 10.11.6locale:[1] en_US.UTF-8/en_US.UTF-8/en_US.UTF-8/C/en_US.UTF-8/en_US.UTF-8attached base packages:[1] stats graphics grDevices utils datasets methods baseother attached packages:[1] knitr_1.15.10 rmarkdown_1.3loaded via a namespace (and not attached): [1] backports_1.0.5 magrittr_1.5 rprojroot_1.2 tools_3.3.2 [5] htmltools_0.3.5 Rcpp_0.12.8 stringi_1.1.2 stringr_1.2.0 [9] digest_0.6.12 evaluate_0.10Or for specific packages
> packageDescription("dplyr")$Version[1] "0.5.0"There's a function in R called sessionInfo that would ideally go in the general README file. So if you run sessionInfo, you're going to get output about the version of R you're using, base packages you're using, other packages that are getting loaded. If you want to know the specific version of a package, then you could say "packageDescription, name of the package, $Version."
Tooling for package versions
- Install old versions of packages using the
devtoolspackage
library(devtools)install_version("ggplot2", version = "0.9.1", repos = "http://cran.us.r-project.org")And so, again, these are useful tools for documenting the versions you'll use and so calling sessionInfo and copying and pasting this into your readme file would be really valuable. In R you can get old versions of packages using the devtools package, and so this line, for example, would allow you to get an old version of ggplot and, again, you can get older versions of packages using this.
Tooling for package versions
- Install old versions of packages using the
devtoolspackage
library(devtools)install_version("ggplot2", version = "0.9.1", repos = "http://cran.us.r-project.org")packratpackage: Installs specific versions of packages in an isolated manner that can be transferred between people
And so, again, these are useful tools for documenting the versions you'll use and so calling sessionInfo and copying and pasting this into your readme file would be really valuable. In R you can get old versions of packages using the devtools package, and so this line, for example, would allow you to get an old version of ggplot and, again, you can get older versions of packages using this.
Another package that's useful for this is called packrat. Packrat will install specific versions of packages in an isolated manner that can be transferred between people. So if you go into a project, instead of updating your package across your entire computer, it updates the package or uses a specific package within your single project and then those packages that you're using can be transferred and be replicated by others.
Tooling for package versions
- Install old versions of packages using the
devtoolspackage
library(devtools)install_version("ggplot2", version = "0.9.1", repos = "http://cran.us.r-project.org")packratpackage: Installs specific versions of packages in an isolated manner that can be transferred between peopleA bunch of complex systems that only demonstrate how hard software versioning is (e.g. Docker)
And so, again, these are useful tools for documenting the versions you'll use and so calling sessionInfo and copying and pasting this into your readme file would be really valuable. In R you can get old versions of packages using the devtools package, and so this line, for example, would allow you to get an old version of ggplot and, again, you can get older versions of packages using this.
Another package that's useful for this is called packrat. Packrat will install specific versions of packages in an isolated manner that can be transferred between people. So if you go into a project, instead of updating your package across your entire computer, it updates the package or uses a specific package within your single project and then those packages that you're using can be transferred and be replicated by others.
There's also a bunch of complex systems that really only demonstrate, I think, how hard software versioning is. So there's the thing called Docker, we've talked a bit about Amazon Machine Images, as ways to keep track of versions that are being used in a data analysis workflow.
R quirks to appreciate for effects on reproducibility
setwd- NEVERattach- NEVER.Rprofile- If you have one, it must accompany project and don't put much/anything in~/.Rprofile- Do not save on quitting:
R --no-save --no-restore-dataThere's also some R quirks to appreciate because of their effects on reproducibility. And so there's a couple functions in R that you should never use, I think the original R developers regret putting these into R. And so these are setwd and attach, setwd you'll more frequently see...this is a way of basically changing directories within R.
So, again, we want to use relative paths relative to the root of your project directory and so when you write your R code, assume that you're running that R code from your root of the project directory, don't use setwd to move in. Just like we don't want to use cd to move into different directories using bash, we don't want to use setwd to change our working directory.
There's another hidden file called the Rprofile file and if you use that, that is a file that runs code...R will run the code in that file when R starts, and so you can hide stuff in there. Your project has an Rprofile file that has some stuff in it, and so if you give people your R code, you need to be transparent about what's in that Rprofile file because any R code that you're running as part of your project is also running what's in that Rprofile file.
And so you'll see in our repository that that Rprofile file is part of what we're keeping under version control. Also, when you run R, do not save on quitting. And so when you're running R in an interactive mode, it will ask if you want to save.
And so you do not want to save and you do not want to restore when you start R and that's because you might be running an analysis and you define Variable A, you quit, you save, and then when you run R again, you start again, and if it restores the data, then A is still alive and A might have a value that you don't anticipate or if you give me your code, I might not have A or the version of A that you have.
So it's really best to not save the data from your session and not to restore the data from a previous session. That saving and restoring really limits the ability to reproduce other people's analyses. So there's other R tooling that are useful for helping with reproducibility.
Ways to leverage R tooling
- Interact with files from other software (e.g. Excel)
- Checking metadata formatting
- Plotting
There's R functions, R packages that allow you to interact with files from other software packages like Excel. So I'll get Excel files for my collaborators and, again, I want to keep my raw data raw, I don't want to muck with that Excel file. Well, there are R packages that allow me to read in data from an Excel file to then work with in my data analysis so I don't have to mess with that Excel file or modify it in any way.
There are also tools for checking your metadata formatting to make sure that if you have a date that it's properly formatted, or that if you have weights of individuals that you don't have negative weights or you don't have weights that suggest somebody weighs three tons. And there's other tools for plotting, all sorts of, you know, amazing stuff that'll allows you to generate all sorts of different types of data visualizations.
Remember that raw data should stay raw
readrpackage for importing data from a variety of text formatsreadxlpackage for reading and writing Excel fileshavenpackage for reading in SAS, SPSS, and Stata data filesgooglesheetspackge for accessing and managing Google spreadsheets- Variety of tools and APIs for accessing web content (e.g.
httr,rvest,rentrez)
So again, in thinking about raw data staying raw, we have a variety of read commands in R for importing data from other formats. As I've mentioned, openxlsx allows you to read in Excel files, there's a haven package for reading things in from SAS or other statistics software, there's a googlesheets package for allowing you to access and manage Google spreadsheets, and there's a variety of tools and APIs for accessing web content.
R Open Site is a group of R developers that are working with public databases to get access using R, so I can public...I can use this last one, rentrez, to do searches of GenBank and PubMed within R, and so that's a really beautiful way to interact with other databases.
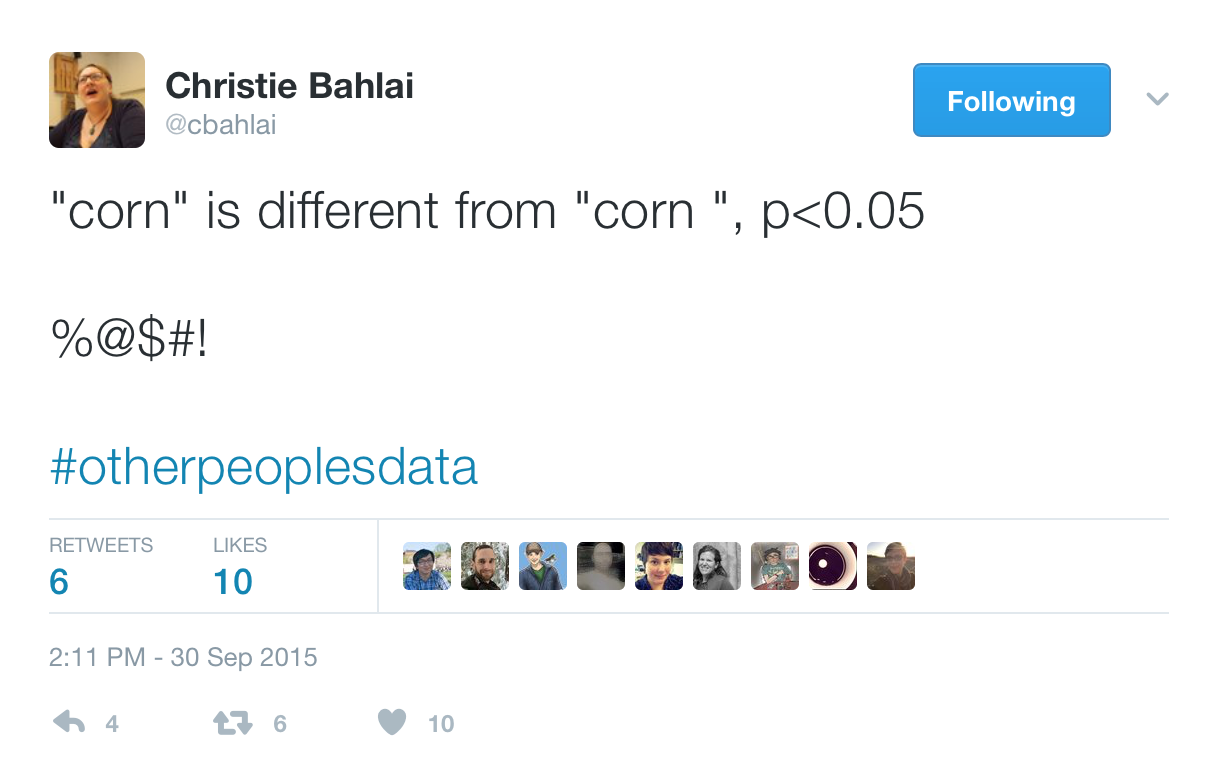
So if we're checking metadata formatting...I love this example from Christie Bahlai who I've mentioned in an earlier tutorial where she did an analysis and she did a statistical test to find that corn is different from corn but where corn in the second case somehow had a space added after it and R thought that those were two different variables, okay?
So this is a fun hashtag, "otherpeoplesdata," if you feel like you've got it bad, go check out what people are posting under this hashtag and you see all sorts of crazy things that people are accidentally doing. And so some tools that we can use for checking metadata include using the "summary" function to make sure that we only have corn, we don't have corn-space, that things are in the right range, that things are the right data type.
Checking metadata formatting
summary(data$crop)- Check for data type (e.g. numeric, logic, character)
- Check for range (e.g. weights of zero)
- Check for NA values
table(data$crop)- Check for number of different types and their frequency
gsub('corn ', 'corn', data$crop)validatepackage allows you tocheck_thatvariables meet certain criteria- googleforms for controlled data entry
You can also use "table" as a function to check for the number of different types and their frequency. You can use things like "gsub" to clean up the text. gsub is a function for finding and replacing text and so, again, if you have programmatically listed out your steps for cleaning up the data, then you can rerun that code without touching your raw data.
So Christie could run this gsub command on her data set and without changing her raw data, it will preserve that typo but in her analysis, she will have corrected for it. And as I mentioned, there's a package called validate that allows you to check variables certain criteria. And then you can also use googleforms that allow you to control for data entry, and so then using some of the googlesheets documentation, you can use R to interact with Google Forms as well as with Google Spreadsheets.
Running R for programmatic analysis
From within R
> source('code/plot_nmds.R')Running R for programmatic analysis
From within R
> source('code/plot_nmds.R')
From command line
$ R -e "source('code/plot_nmds.R')"So, great, how do we run R outside of R? Well, we can...you know, from within R, we could say like we did earlier, source code/plot_nmds.R, we just saw this with running that utilities file. From the command line, we could type R, -e for execute, and then this line of code, source code/plot_nmds.R.
Running R for programmatic analysis
From within R
> source('code/plot_nmds.R')
From command line
$ R -e "source('code/plot_nmds.R')"
Another example
$ R -e "source('code/utilities.R'); calc_shannon(c(1,1,1,1,2,4,5,6,7))"So, great, how do we run R outside of R? Well, we can...you know, from within R, we could say like we did earlier, source code/plot_nmds.R, we just saw this with running that utilities file. From the command line, we could type R, -e for execute, and then this line of code, source code/plot_nmds.R.
We could stitch together multiple R commands with a semicolon.
What are we doing again? We've talked a lot about using R and the wonderful things we can do with R and, of course, to be fair, you know, many of these things...pretty much all of these things we can do with Python and other languages as well. But our goal here is to generate code that is robust to errors that we might incorporate or others might incorporate so that the analyses can be replicated, but also to make code that's better and more reproducible.
And so by automating our code, we can make that code in our overall analysis much more reproducible.
################################################################################## plot_nmds.R## Here we take in the *.nmds.axes file from the mouse stability analysis and# plot it in R as we did in Figure 4 of Kozich et al.## Dependencies: 2-D axes file generated by the nmds command in mothur# Produces: results/figures/nmds_figure.png#################################################################################plot_nmds <- function(axes_file){ axes <- read.table(file=axes_file, header=T, row.names=1) day <- as.numeric(gsub(".*D(\\d*)$", "\\1", rownames(axes))) early <- day <= 10 late <- day >= 140 & day <= 150 plot_axes <- axes[early | late, ] plot_day <- day[early | late] plot_early <- early[early | late] plot_late <- late[early | late] pch <- vector() pch[plot_early] <- 21 pch[plot_late] <- 19 output_file_name <- "results/figures/nmds_figure.png" png(file=output_file_name) plot(plot_axes$axis2~plot_axes$axis1, pch=pch, xlab="PCoA Axis 1", ylab="PCoA Axis 2") legend(x=max(plot_axes$axis1)-0.125, y=min(plot_axes$axis2)+0.125, legend=c("Early", "Late"), pch=c(21,19)) dev.off()}Again, I didn't mean for this to be a tutorial on how to program an R but I wanted to highlight some of the tooling and approaches that you might take to make your analyses more reproducible and more robust. At long last, we're going to go back into AWS and we're going to add some R code as we close out this session, so I'll go AWS.
And hopefully, you've gotten accustomed to doing this like second nature. Grab the IP address. And we're in, great.
So we'll cd into Kozich, so I'm going to create a new file in code called plot_nmds, so I'll do nano code/plot_nmds.r and I'm going to copy this code in here and save it.
Exercise
- Add a line to the
analysis_driver.bashscript to run the R file from the command line - Run the code and commit the new file and changes
- Add comments to
code/plot_nmds.Rand add one or two things to make the code more defensive (e.g. confirm number of columns is 2; what if the names don't have a "D"?) - Run the code and commit the new file and changes
And to run this, I want to double check that I know what the dependencies are and what it produces, so the dependencies are a 2D axes file generated by the nmds command in Mothur.
And so when I run plot_nmds, I need to give it the name of that axes file, it's going to produce a file called results/figures/nmds_figure.png. Great, so this will be very useful information as we put this into our analysis_driver.bash file, so I'll save this and come out.
And so I will go to the bottom of this file and I'll say, "Construct NMDS png file," and I will then do R -e source('code/plot_nmds.R'). And then I need to call this function, so plot_nmds, parentheses, and then in single quotes, I'm going to put the name of the NMDS file and then that's going to end in double quotes.
But I forgot the name of the file, so let's save this and back out and then do ls data/mothur and then it ends in nmds.axes. And so here is the horribly long file name, so I will copy this and I will go back into my analysis_driver.bash file, come back to the end, and inside those single quotes, I will paste that name of the file.
And so I'm going to copy this line because I don't want to run the entire analysis_driver.bash file, I just want to run this line, and so I will quit out, I will save it, and I will run that. It says there's an unexpected end of input and I think that's because I have some weird spacing going on when I copied and pasted, so I will get rid of that space and run it again.
Oh, there's another space up here, these are the problems with copying and pasting. You know what? I'm going to show you a different way to do this. So a useful function as you're building your analysis_driver.bash file if you want to do this copying and pasting is tail, so if we do "tail analysis_driver.bash," we get the last five lines of our file and so I can copy this now.
I think using nano...copying and pasting from nano is introducing some weird line breaks. So I can paste this in, it runs, it looks like it built some type of plot, and we remember from the header of our plots_nmds.R file, then it put the figure into results, figures, and then nmds_figure.png.
And so if you forget the path, what I'm doing is if I hit Tab twice, it'll tell me the directories that are within results, so then I could do results, figures, hit Tab twice, it shows me what's there: nmds_figure.png. But I don't know how to open that, do you remember how to open that?
Right, we can use FileZilla, so let's see if we can use FileZilla to open up this nmds_figure file to see what it looks like. So I'm going to come into my applications and I didn't put this in my...for some reason, I don't have this in my doc but I'm going to go ahead and do FileZilla.
And I want to connect and I need to put in my new IP address in here and so to do that, I need to come over to the EC2 and highlight this and copy and then go back to FileZilla and paste it in here and then say, "Connect," "OK."
And there is my Kozich directory. Double-click on that, we said it was in "results," "figures." Here's the moment of truth, how's it look? It looks great, so that's what the PNG file looks like, okay? And so, again, we can use FileZilla to access the files and move things back and forth and carry on.
So I'm going to stop here with FileZilla and AWS and so I'm going to close all these things and I'm going to go back to my terminal window and do exit, exit, exit, and over here, I'm going to stop my instance.
Actually, you know what? Before I stop my instance, I forgot to do something really important. I forgot to do something really important which was I forgot to commit my changes. So I'm going to log back in, I'm going to then cd into Kozich, I do git status. I see that I've got some other weird things going on in here now that I didn't anticipate, so things like code.plot.nmds.swp.
I'm going to delete that because I don't...it's not under version control, I'm not using it, I'll do rm that. And if I do git status...I'm not sure what that R directory is or that R file is, so I'm going to add that to my gitignore and up here I'm going to add R.
Quit that, git status, and so now I see I've got four files so I'm going to git add gitignore analysis_driver.bash code/plot_nmds.R results/figures/nmds_figure, git status. So those are all ready to be committed, I can do git commit, "Generate NMDS figure," git status, we're good to go, and I'll go ahead and git push and add my credentials.
Now we're ready to quit, so exit, exit, and I will then come back to "Actions" here, "Instance State,""Stop," "Yes, Stop." So we've already done the first exercise I had asked...was planning on asking you to do of adding a line to the analysis_driver.bash script to run the R file from the command line, we did commit it.
So what I'd like you to also do is to perhaps add some comments. You did this previously in an earlier tutorial, so add those comments to the code plot_nmds.R file and add perhaps one or two things to make the code more defensive. Perhaps you could confirm the number of columns as two in the file, what if the names don't have a D in them, and then run the code and commit the new file and changes.
I hope you now have a better understanding for why using tools like R or Python can help make your analyses more reproducible than, say, using a tool like Microsoft Excel. Beyond reproducibility, I love using R because there's a community of wonderful data scientists who are constantly striving to make the language better by expanding the tools we have for working with data and for making cool data visualizations.
If you're interested in learning more about R, I would suggest that you check out my minimalR tutorial which is also available on the riffomonas.org website. There's an R package that has been a total game changer for my research group, it's called R Markdown. As we'll see in the next tutorial, this is the way to blend written text with R code.
Have you ever had the updated analyses and then find that you need to update all the p-values, summary statistics, perhaps you have a table with a bunch of numbers in it and you have to update those as well? That can be really tedious, right? It's also prone to having a lot of errors. R Markdown is a way to avoid all that tedium and error. I can't wait to share with you how R Markdown has been so instrumental in improving the reproducibility of the manuscripts coming out of my research group.