Juneteenth 2021: Using ggplot2 and R to create a map showing the history of lynchings (CC117)
Data
You can request the data I used in this episode from the CSDE Lynching Database.
Visuals
Code
This is the R script that I generated in this episode
library(tidyverse)
library(ggtext)
state_lookup <- tibble(abb = state.abb,
state = state.name)
lynchings_per_state_county <- read_csv("Weblist_IDs.csv") %>%
rename_all(tolower) %>%
filter(victimsrace == "Black") %>%
count(lynchstate, lynchcounty) %>%
inner_join(., state_lookup, by=c("lynchstate" = "abb")) %>%
mutate(county = tolower(lynchcounty),
state = tolower(state)) %>%
select(state, county, n) %>%
mutate(county = str_replace_all(county, "\\.", ""),
county = case_when(
state == "arkansas" & county == "probably white" ~ "white",
state == "florida" & county == "dade" ~ "miami-dade",
state == "florida" & county == "desoto" ~ "de soto",
state == "georgia" & county == "campbell" ~ "fulton",
state == "georgia" & county =="dekalb" ~ "de kalb",
state == "georgia" & county == "unidentified southwest georgia county" ~
"decatur",
state == "georgia" & county == "wilkerson" ~ "wilkinson",
state == "louisiana" & county == "arcadia" ~ "bienville",
state == "louisiana" & county == "desoto" ~ "de soto",
state == "louisiana" & county == "la fourche" ~ "lafourche",
state == "mississippi" & county == "desoto" ~ "de soto",
state == "virginia" & county == "alexandria" ~ "richmond",
state == "virginia" & county == "princess anne" ~ "virginia beach",
state == "virginia" & county == "dinwiddlie" ~ "dinwiddie",
state == "virginia" & county == "warwick" ~ "newport news",
TRUE ~ county
)
)
state_county <- map_data("county") %>%
select(region, subregion) %>%
distinct()
anti_join(lynchings_per_state_county, state_county,
by=c("county" = "subregion", "state" = "region"))
county_map <- lynchings_per_state_county %>%
distinct(state) %>%
inner_join(., map_data("county"), by=c("state" = "region"))
state_map <- lynchings_per_state_county %>%
distinct(state) %>%
inner_join(., map_data("state"), by=c("state" = "region"))
lynchings_map_data <- right_join(lynchings_per_state_county, county_map,
by=c("state" = "state", "county" = "subregion"))
lynchings_map_data %>%
mutate(n = if_else(is.na(n), 0L, n)) %>%
ggplot(aes(x=long, y=lat, fill=n, group=group)) +
geom_polygon(color="black", size=0.1) +
geom_polygon(data=state_map, aes(x=long, y=lat, group=group),
fill=NA, color="black", size=0.3) +
scale_fill_gradient(name="Number of\nLynchings",
low="#FFFFFF", high = "#FF0000",
limits=c(0, NA)) +
coord_quickmap() +
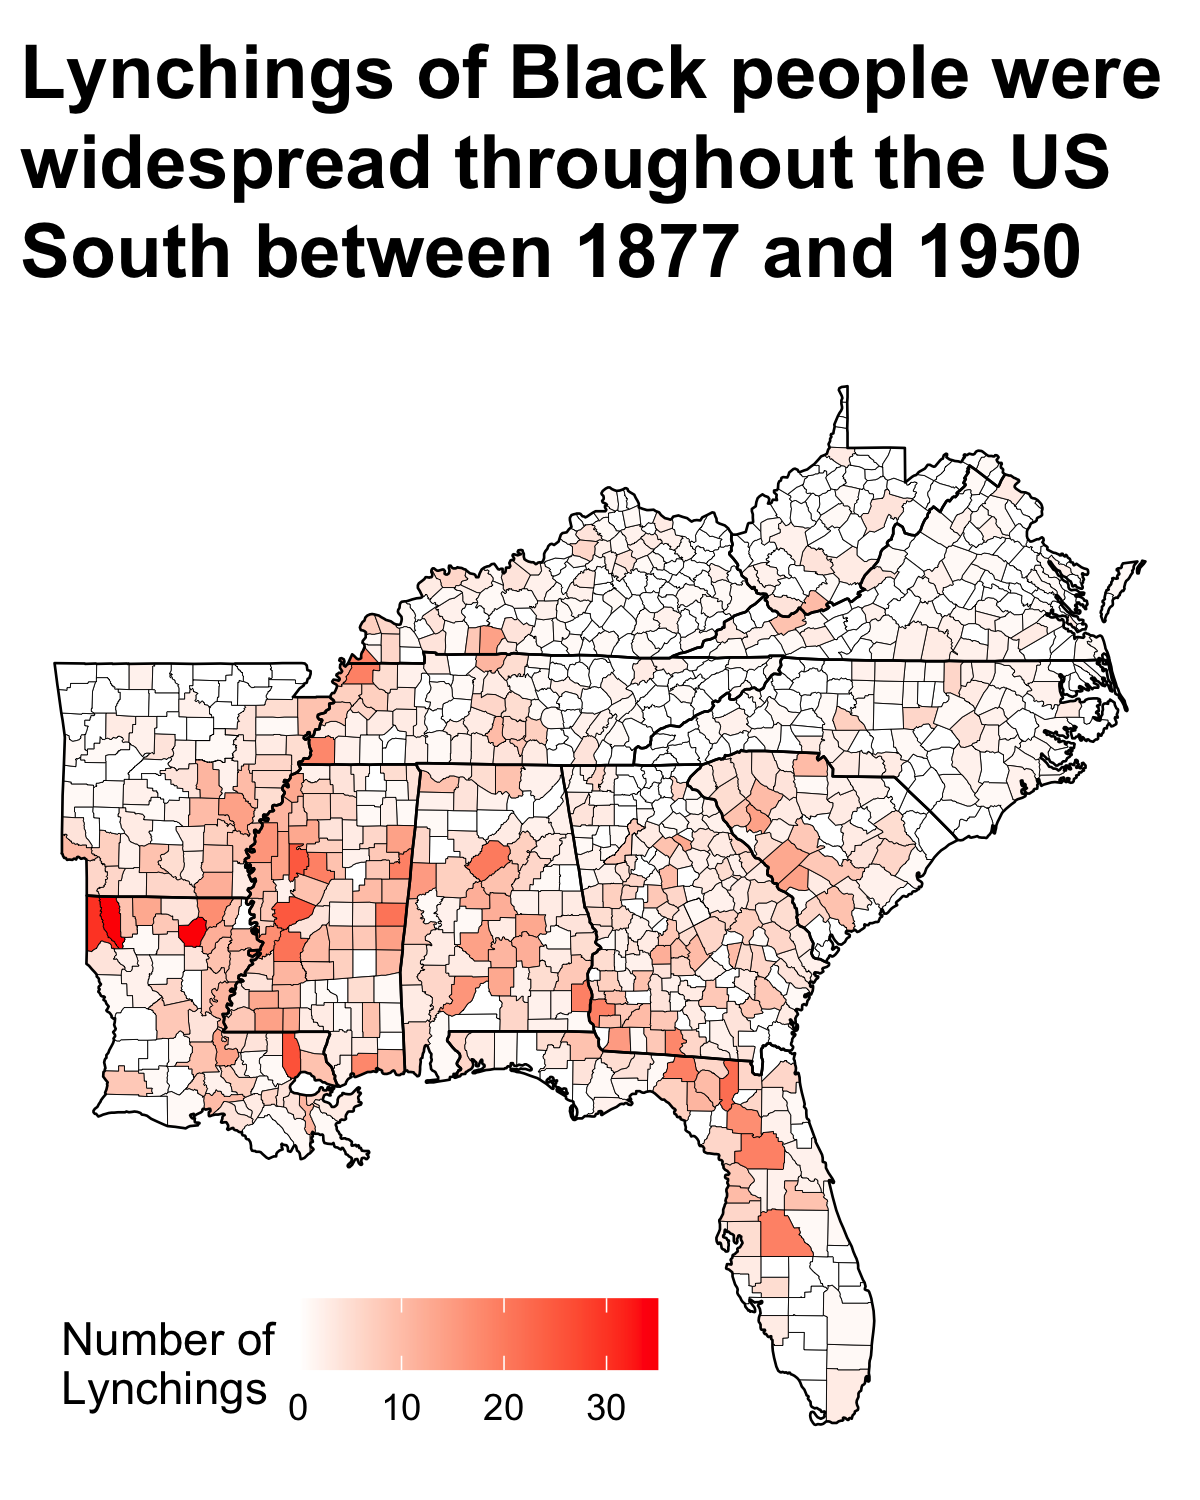
labs(title="Lynchings of Black people were widespread throughout the US South between 1877 and 1950") +
theme_void() +
theme(
plot.title = element_textbox_simple(face="bold", size=18,
margin = margin(5, 0, 10, 5)),
legend.position =c(0.3, 0.1),
legend.direction = "horizontal"
)
ggsave("lynchings_map.tiff", height=5, width =4)